
BandwagonHost安装哪吒监控(Nezha Monitoring) Nginx 反代 HTTPS 完整教程
来自md5.pw
更多语言
更多操作
BandwagonHost安装哪吒监控(Nezha Monitoring)+ Nginx 反代 + HTTPS 完整教程
一、什么是哪吒监控(Nezha Monitoring)
哪吒监控(Nezha Monitoring)是一款开源、自托管、轻量级的服务器与网站实时监控和运维工具。它支持通过 Dashboard 查看系统状态、资源使用情况,并通过 Agent 采集被监控主机数据。
在本文中,我们将一步一步教你如何从零开始在BandwagonHost(搬瓦工) 机器上使用docker安装与部署哪吒监控(Nezha Monitoring)系统的 Dashboard 面板,使用nginx反代Dashboard,并配合 Agent 安装与基本配置内容。
二、部署前的准备
1、服务器与网络条件:
- 一台 BandwagonHost(搬瓦工) 或者其他可以访问公网的服务器
- 服务器防火墙和安全策略需允许 Dashboard 使用的端口(默认是 8008)
- 推荐的规格:单核 + 512MB 内存 对于大部分场景足够。
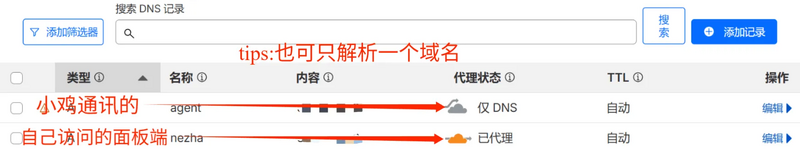
2、域名设置
- 一个已设置好 A 记录 指向 Dashboard 服务器 IP 的域名
- 如果面板端使用 CDN,还建议准备第二个域名用于 Agent 通信(不通过 CDN)

三、安装 Dashboard 面板
1. 运行官方安装脚本
在你的 Dashboard 服务器终端执行以下命令来获取并运行官方安装脚本:
curl -L https://raw.githubusercontent.com/nezhahq/scripts/refs/heads/main/install.sh -o nezha.sh && chmod +x nezha.sh && sudo ./nezha.sh
如果你的服务器位于中国大陆,可以使用镜像:
curl -L https://gitee.com/naibahq/scripts/raw/main/install.sh -o nezha.sh && chmod +x nezha.sh && sudo CN=true ./nezha.sh


在浏览器中输入 http://your_server_ip:8008 可以访问哪吒监控的 Web 界面。
四、使用nginx反代
1、安装nginx
sudo apt update
sudo apt install -y nginx
启动并设置开机自启:
sudo systemctl start nginx
sudo systemctl enable nginx
2、申请证书
- 安装 Certbot + Nginx 插件 Certbot 是 Let's Encrypt 官方推荐的证书管理工具
python3-certbot-nginx插件可以 自动修改 Nginx 配置。安装完成后,检查版本:sudo apt install certbot python3-certbot-nginx
certbot --version - 申请证书
sudo certbot --nginx -d 你的域名
3、配置nginx配置文件
文件路径一般在 /etc/nginx/sites-available/default
server {
    listen 443 ssl http2;
    listen [::]:443 ssl http2;

    server_name dashboard.example.com; # 替换为你的域名
    ssl_certificate          /data/letsencrypt/fullchain.pem; # 域名证书路径
    ssl_certificate_key      /data/letsencrypt/key.pem;       # 域名私钥路径
    ssl_stapling on;
    ssl_session_timeout 1d;
    ssl_session_cache shared:SSL:10m; # 如果与其他配置冲突,请注释此项
    ssl_protocols TLSv1.2 TLSv1.3;

    underscores_in_headers on;

    # grpc 相关
    location ^~ /proto.NezhaService/ {
        grpc_set_header Host $host;
        grpc_set_header nz-realip $remote_addr;
        grpc_read_timeout 600s;
        grpc_send_timeout 600s;
        grpc_socket_keepalive on;
        client_max_body_size 10m;
        grpc_buffer_size 4m;
        grpc_pass grpc://dashboard;
    }
    # websocket 相关
    location ~* ^/api/v1/ws/(server|terminal|file)(.*)$ {
        proxy_set_header Host $host;
        proxy_set_header nz-realip $remote_addr;
        proxy_set_header Origin https://$host;
        proxy_set_header Upgrade $http_upgrade;
        proxy_set_header Connection "upgrade";
        proxy_read_timeout 3600s;
        proxy_send_timeout 3600s;
        proxy_pass http://127.0.0.1:8008;
    }
    # web
    location / {
        proxy_set_header Host $host;
        proxy_set_header nz-realip $remote_addr;
        proxy_read_timeout 3600s;
        proxy_send_timeout 3600s;
        proxy_buffer_size 128k;
        proxy_buffers 4 256k;
        proxy_busy_buffers_size 256k;
        proxy_max_temp_file_size 0;
        proxy_set_header X-Forwarded-Proto $scheme;
        proxy_pass http://127.0.0.1:8008;
    }
}

upstream dashboard {
    server 127.0.0.1:8008;
    keepalive 512;
}
重新加载nginx服务
sudo systemctl restart nginx
五、配置面板
1、通过域名访问你的面板

2、登录管理后台修改密码 初始账号密码都是 admin


六、添加机器
1、复制安装命令

2、安装Agent

3、之后就可以在前台看见这个机器了

4、可以添加更多的机器
将复制的指令在其他机器上执行就可以实现监控其他的机器的状态(只需要执行命令即可不需要再次安装面板端)
七、最终效果
